3 Debugging
Goals
- Explore common debugging techniques.
- Introduce
pdbandipdb. - Take a look at VS Code’s Debugger.
What is Debugging?
As you’re probably already aware, debugging is as much a part of programming as writing code.
While tests can help identify & prevent errors– the errors themselves are inevitable, and all but the simplest programs are guaranteed to have bugs.
While sometimes you may see an error and immediately realize what caused it– “Oh! I forgot to update that method to take a third parameter!”, more often you find yourself saying “Wait… what?”
At any significant level of complexity, just staring at your code is not going to help you find the bug. You are going to need to explore what it is doing, following the reasoning in the code to see where it differs from your expectation or intention.
To illustrate this we’ll walk through three different levels of debugging:
Rubber Duck Debugging
The first level is just looking at your code and trying to reason about it.
You do this all the time when you encounter a syntax error:
File "syntax_err.py", line 1
    for x in [1, 2, :
                    ^
SyntaxError: invalid syntax
While that message may have mystified you at the beginning of your journey, at this point you can easily spot what is wrong, and make the fix.
Have you ever found that talking about your code with someone, even if they aren’t a programmer has helped you identify the error?
def count_odds(data):
    accum = 0
    for x in data:
        if x % 2 == 1:
            x += 1
    return accum
Do you see the bug?
If we talk through it would you?
We create an accumulator variable. Then we walk through the data one item at a time. If the number modulo two has a remainder of 1, it is odd. If it is odd, we add one to the… wait!
We are adding one to the variable, not the accumulator!
So where’s the duck?

rubber duck 006 - chan yiu hao from licensed CC-BY
This technique is named after a story in the book The Pragmatic Programmer by Andrew Hunt and David Thomas. The story goes that a programmer would carry around a rubber duck and explain their code to the duck. Often, in the process of explaining the code, the programmer would realize what was wrong.
You may find that it doesn’t matter if there’s another person there: talking to a rubber duck, pet, or plant may be beneficial.
And yes, it helps if it is out loud.
This helps build an important skill & should not be overlooked, but obviously won’t solve all your problems.
Print Debugging
Sometimes we need to see what is going on when a program runs.
In an interpreted language like Python we can lean on print statements. We may use this when running the whole program, or use the REPL to import the problematic function and explore different inputs and outputs.
They allow you to see the state of your program at any point in time.
While handy, particularly for small programs, they come with some downsides:
- You have to add them to your code, run it, and remember to remove them.
- They can clutter up your code & output, making it harder to read.
- Debugging code in a loop or frequently-called function can be tedious with a ton of print output to sift through.
- You have to know before running your program what you want to see, if you identify a problem later you have to add more print statements and run it again.
A few tips for effective print debugging
- The first place to add a
printstatement is at the top of a function, printing its name and all of its arguments:
def func(x, y):
    print(f"func({x=}, {y=})")
This can help you understand the control flow of the program, and hone in on the section that needs a more careful look.
The
{x=}f-string syntax as seen in the above example prints the name of the variable, so a callfunc(3, 4)would printfunc(x=3, y=4).Always print something unique to identify the print statement.
For example, in this code that modifies a variable repeatedly, we want to see where things went wrong:
print("AAA", x)
x = f(x)
print("BBB", x)
x = g(x)
print("CCC", x)
The strings "AAA", "BBB", "CCC" could be anything, so long as they are distinct and unlikely to be confused with other output.
This will help you match the output up to the line it occurred upon.
You can spend more time adding meaningful labels if you wish, but since they’ll be deleted soon, many people prefer nonsense words/strings.
Logging Statements
While we won’t cover them in detail this is a good time to mention the concept of logging within a program.
Logging statements are similar to print statements, but they are more flexible and can be turned on and off.
Python provides a built-in module logging which can be used like:
import logging
import httpx

def fetch_url(url: str):
    logging.info(f"fetch_url - {url}")

    resp = httpx.get(url)
    if resp.status_code != 200:
        logging.warning(f"fetch_url received a {status_code} from {url} ")
    ...

    return resp
These logging statements could be left in, unlike print statements.
The logging module gives us the ability to choose both where the logging statements go, and what levels are logged.
Typically, in order:
- debug
- info
- warning
- error
- critical
With the ability to define custom levels as well.
So, in normal execution we might want to see warnings, a bad response from a website. If we’re trying to better understand the flow of the program, we might instead turn on info statements By adding logging statements at different levels of severity you can adjust at runtime how much information you want to see. Typical logging levels are: DEBUG, INFO, WARNING, ERROR, and CRITICAL. You can log messages at any of these levels and then set the logging level to control which messages are displayed.
For more, see Python’s logging module.
Interactive Debugging
Finally, we have interactive debugging.
This allows you to interact with the program as it runs, pausing the execution to inspect the variables and can let you literally watch the program run line-by-line to see where the error occurs.
Python has a built-in debugger named pdb. We’ll use ipdb, which embeds ipython and has the same benefits that ipython does over the regular python REPL. Most of what we’ll see works for regular PDB as well.
Running the Debugger
You can run the debugger from the command line, which would look like:
$ python -m pdb my_script.py
$ python -m pdb -m my_module
The first form executes a script, while the second runs the pdb module, telling it in turn to run my_module.
If we use ipdb it will need to be installed. With uv that would look like:
$ uv add ipdb  # if not already installed in this package
$ uv run python -m ipdb -m my_module
PDB Commands
Once the program is run this way, it will let you step through the lines one line at a time.
A few of the most common commands and their 1-character shortcuts:
next - step to next line (aka step over)step - step into a function call (aka step into)return - continue until the current function returns (aka step out)continue - continue until the next breakpointlist - list the current line of codeprint - print the value of a variablequit - quit the debugger?/help- show a list of commands
$ python -m ipdb debugging/example1.pyBreakpoints
Starting from the beginning can be tedious, usually you will want to start the debugger sometime after the program starts, but closer to the trouble area you’re debugging.
Python has a built in statement for this, breakpoint()
You may see older code use import pdb; pdb.set_trace() instead. breakpoint is more flexible and available after Python 3.7.
This will pause execution at that point and allow you to step through your code.
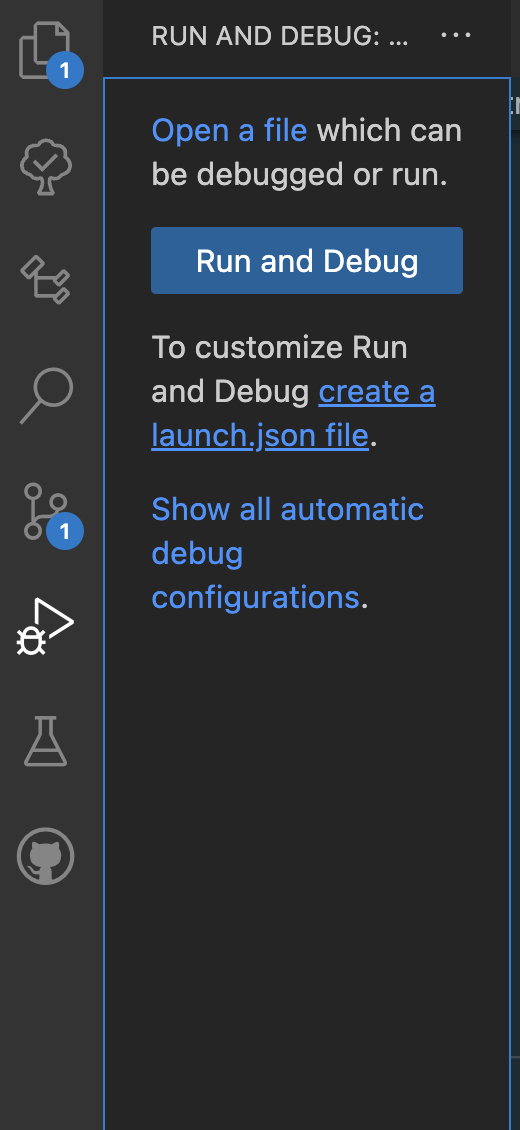
Visual Studio Code Debugger
Finally, most editors, including Visual Studio Code have debugger integration.
To use VS Code’s integration, you’ll need to add a launch.json file to your project.
This file tells VS Code how to run your program and what to do when you start debugging.
You can create a launch.json file by clicking on the debug icon in the sidebar and then clicking the gear icon to create a new launch configuration.
This will create a launch.json file in your .vscode directory. You can then edit this file to configure your debugger.
Here’s an example launch.json file:
{
    "version": "0.2.0",
    "configurations": [
        {
            "name": "Python: Current File",   // this is the name that will show up in the dropdown
            "type": "python",
            "request": "launch",
            "program": "${file}",             // this tells VSCode to run the current file
            "arguments": ["arg1", "arg2"],    // if your program requires arguments you'll need to add this
            "console": "integratedTerminal",
            "justMyCode": true                  // this tells VSCode to not step into external libraries
        }
    ]
}
Further Exploration
If you are using pdb/ipdb, you may find this Debugging Cheat Sheet helpful.